|
NOC - OCEAN CURRENTS COMPUTER SIMULATION
|
||
|
NOC COMPUTER GLOBAL OCEAN CURRENT SIMULATION - Dr Katya Popova, an ocean modeller at the NOC held workshops at the Ocean Business event in April 2015. This could be an invaluable tool for projects like the SeaVax ocean cleaning robots if allied to the proposed SeaNet fleet operations. At the time of writing SeaVax is a 'proof of concept' model, with the team now looking to design and build a full size prototype.
The spread of oil spills and marine pollution through the world’s oceans can now be simulated on computer models developed by the National Oceanography Centre to help the marine industry manage and measure risk.
These novel techniques will be demonstrated at Ocean Business, the hands-on ocean technology event hosted by the National Oceanography Centre (NOC) in Southampton 14-16 April 2015. There will be touch screen displays of the latest interactive computer simulations of global ocean circulation.
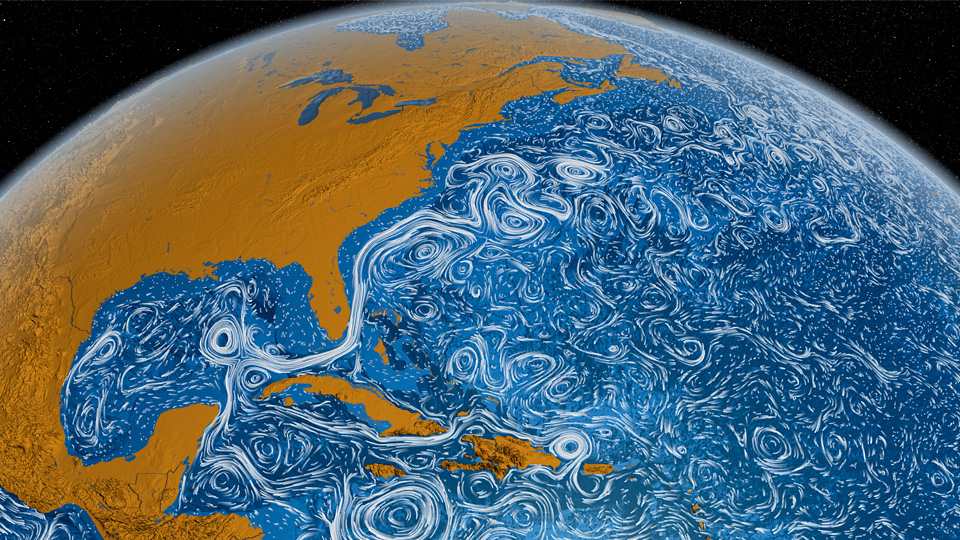
The Scientific Visualization Studio at NASA’s Goddard Space Flight Center created
a beautiful animation called Perpetual Ocean which visualises the ocean’s surface currents over a 30-month period between June 2005 and December 2007.
The ocean is a turbulent fluid that is driven mainly by the mechanical forcing of the winds and the net effect on density of surface exchanges of heat and moisture. It responds according to physical laws for the conservation of mass, momentum, energy, and other properties. The resulting three-dimensional (3D) flows are strongly influenced by Earth's rotation and are regulated by internal mixing and boundary friction. The currents are particularly narrow and strong at the western side of ocean basins and in a belt around Antarctica.
Many ocean properties such as temperature, salinity, dissolved oxygen, and biogeochemical tracers have local maxima in the cores of strong currents. Consequently, a proper representation of transports of these properties involves not only the means of individual variables but also relatively small-scale correlations with velocity. Furthermore, significant changes of the currents and property transports occur in response to modified surface forcing, and the correct simulation of these responses is crucial to solving a variety of problems ranging from understanding the history of the Earth system to predicting future climates. These are the challenges for ocean modeling.
Over 5000 people are expected to attend Ocean
Business, which will showcase the latest advances in ocean technology. The three-day event is the second largest of its kind in Europe with over 300 exhibitors taking part. There will be workshops, waterfront demonstrations and training events in addition to the exhibition.
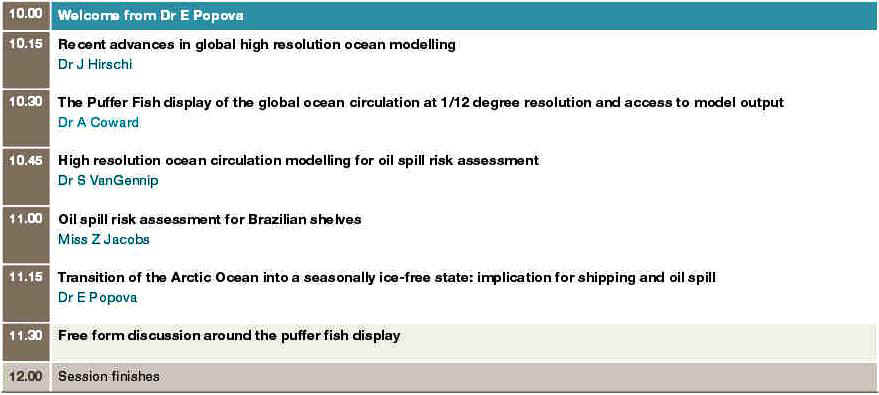
NOC SEMINAR ROOM
- Tuesday, 14 April,
1000-12noon
The workshop will cover online availability of the data, technical aspects of the model, its verification, future development, examples of circulation fields and their analysis. Examples will be presented for various applications in a number of regions around the world (including UK shelves, Falkland Islands, Brazilian continental shelf, Great Australian Bight and Baffin Bay). The Arctic Ocean circulation and its sea-ice (including future projections of its retreat) is a particular strength of the model and special attention will be paid to the model’s performance and its potential applications in the Arctic. The workshop will consist of a number of short presentations followed by an informal demonstration session using a variety of display equipment, including our large-scale 360 degree spherical display system. Experts developing the model and its applications will be available throughout the day.
AGENDA
CONTACTS
Zoe Jacobs zlj1e13@soton.ac.uk Mobile: 07795550625
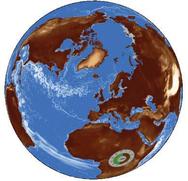
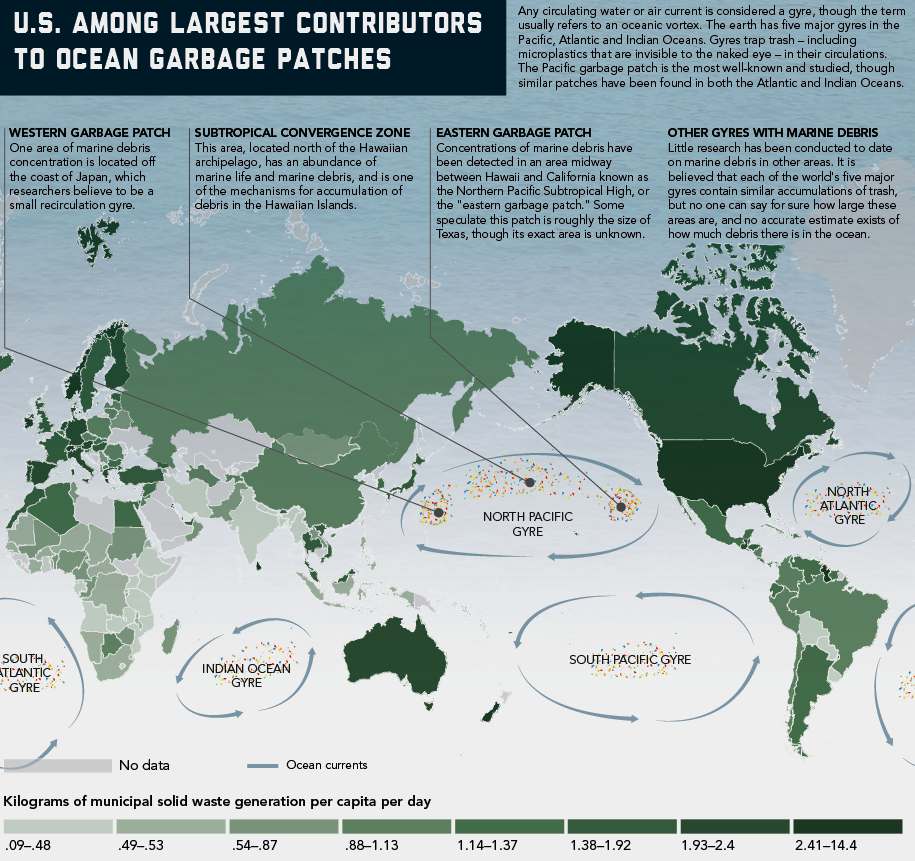
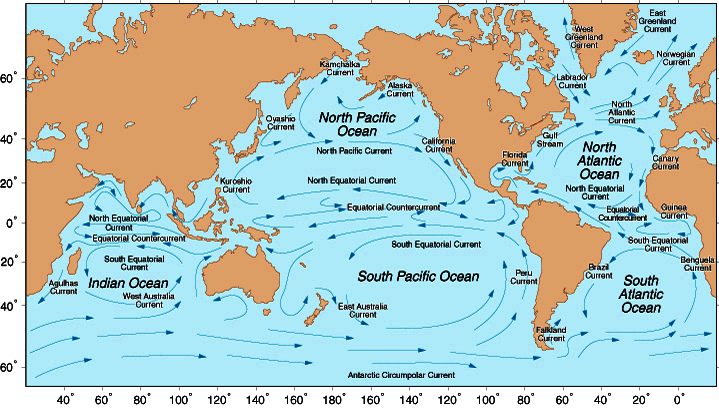
STATIC OCEAN CURRENT SNAPSHOT - This is a superb illustration of the North and South Pacific garbage patches, compared to the North and South Atlantic gyres. The North Pacific gyre is just one of several swirling trash zones (gyres) in our oceans, and it's where a lot of our plastic litter ends up. Where such illustrations serve to educate the public, a live simulation that planners can use in real time to improve the efficiency of their operations - could be a boon if the powers that be are serious about tackling plastic ocean waste.
NOAA ON OCEAN CURRENTS
Ocean water is constantly on the move, affecting your climate, your local ecosystem and the seafood that you eat. Ocean currents, abiotic features of the environment, are continuous and directed movements of ocean water. These currents are on the Ocean’s surface and in its depths, flowing both locally and globally.
Winds, water density and tides all drive ocean currents. Coastal and sea floor features influence their location, direction, and speed. Earth’s rotation results in the Coriolis Effect which also influences ocean currents. Similar to a person trying to walk in a straight line across a spinning Merry-Go-Round, winds and ocean waters get deflected from a straight-line path as they travel across the rotating Earth. This phenomenon causes ocean currents in the Northern Hemisphere to veer to the right and in the Southern Hemisphere to the left.
Surface Currents
Large–scale, surface ocean currents are driven by global wind systems that are fueled by energy from the sun. These currents transfer heat from the tropics to the polar regions, influencing local and global climate. The warm Gulf Stream originating in the tropical Caribbean, for instance, carries about 150 times more water than the Amazon River. The current moves along the U.S. East Coast across the Atlantic Ocean towards Europe. The heat from the Gulf Stream keeps much of Northern Europe significantly warmer than other places equally as far north.
Locally along a beach, long-shore and rip currents form and are influenced by winds, tides, and land formations. The interaction of these factors can result in currents that flow parallel (long-shore) or perpendicular (rip currents) to the shore. Rip currents are particularly dangerous and take dozens of beach-goers' lives every year by pulling them swiftly away from shore. Coastal currents move sand and sediment along the shoreline eroding some areas and creating new beaches and shallows in others.
As tides move across the Earth, they encounter islands and continents as the Earth rotates beneath them. The resulting tidal currents can be extremely fast in these places especially when the tidal range is large.
A comparison of 1993 through 1994 average sea-surface elevation from (A) a 1/4° model and from (B) TOPEX/POSEIDON altimetry. Recent improvements in wind stress and surface heating applied to the model, and in the observed gravitational field used with satellite data, have reduced the root-mean-square difference between the two elevation fields to only 16.8 cm. [Courtesy of D. Stammer and R. Tokmakian]
Deep Ocean Currents
Differences in water density, resulting from the variability of water temperature (thermo) and salinity (haline), also cause ocean currents. This process is known as thermohaline circulation. In cold regions, such as the North Atlantic Ocean, ocean water loses heat to the atmosphere and becomes cold and dense. When ocean water freezes, forming sea ice, salt is left behind causing surrounding seawater to become saltier and denser. Dense-cold-salty water sinks to the ocean bottom. Surface water flows in to replace the sinking water, which in turn becomes cold and salty enough to sink. This "starts" the global conveyer belt, a connected system of deep and surface currents that circulate around the globe on a 1000 year time span. This global set of ocean currents is a critical part of Earth’s climate system as well as the ocean nutrient and carbon dioxide cycles.
Biological Influence
Ocean currents are an important abiotic factor that significantly influences food webs and reproduction of marine organizms and the marine ecosystems that they inhabit. Many species with limited mobility are dependent on this "liquid wind" to bring food and nutrients to them and to distribute larvae and reproductive cells. Even fish and mammals living in the ocean may have their destinations and food supply affected by currents.
Upwelling currents bring cold nutrient-rich waters from the ocean bottom to the surface, supporting many of the most important fisheries and ecosystems in the world. These currents support the growth of phytoplankton and seaweed which provide the energy base for consumers higher in the food chain, including fish, marine mammals, and humans.
Comparison of the standard deviation of sea-surface height (A) observed by the TOPEX/POSEIDON satellite [courtesy of S. Nerem] and (B) simulated in a 1/6° global model at Los Alamos [courtesy of R. Smith]. Observations are shown for a shorter time period (17 months versus 9 years) and with a greater degree of spatial smoothing than the model output.
HARNESSING THE POWER OF SUPER COMPUTERS
- HISTORY
MODELING OCEAN GARBAGE PATCHES USING SATELLITES
Nikolai Maximenko, a Senior Researcher at the International Pacific Research Center at the University of Hawaii, has constructed a model that shows the pull of garbage patches in dramatic fashion. His model is based on the movements over five days of 12,000 satellite-tracked drifters that had been released worldwide as part of NOAA’s global drifter program. Maximenko divided the ocean up into grids of squares called bins and calculated the probabilities that drifters occupying each bin would move into each one of the adjacent bins. Then he ran simulations based on these probabilities in which he released virtual drifters and tracked them for up to one thousand years. The model showed that after ten years, the density of drifters increased significantly in five regions of the subtropical ocean. The two most dramatic increases took place in the area corresponding to the North Pacific garbage patch and in the eastern South Pacific.
The potential garbage patches that Curtis Ebbesmeyer and Maximenko have identified sit beneath large subtropical high-pressure systems. These high-pressure systems are the likely driving forces that create the garbage patches. The high pressure systems form from the warm moist air that rises above the equator, diverges towards the poles, then after losing heat and moisture, sinks at about 30 degrees north and south. (Much of the air then speeds back towards the equator, creating the trade winds. These closed loops of air circulating between the equator and subtropics are called Hadley cells.) As air moves away from these subtropical highs, Earth’s rotation (the Coriolis effect) deflects it so that it rotates around the high pressure systems; clockwise in the northern hemisphere and counterclockwise in the southern hemisphere. These rotating winds create ocean currents. The Coriolis effect then steers the ocean currents back towards the high-pressure systems (Ekman transport). It is these currents that carry the debris into the garbage patch.
Once beneath the high-pressure systems, the floating debris appears to meander aimlessly. Ebbesmeyer says that shifting winds occasionally dislodge a chunk of debris, much of it plastic that has been broken down into confetti-sized plastic bits, and pushes it on shore. These massive deposits of trash fouling the beaches are boons to beachcombers since they often contain objects that have been afloat for decades. But they are a stark reminder of the tremendous volumes of trash floating in the ocean.
The fact that garbage patches are located beneath high-pressure systems also helps explain why it took so long for people to notice them. These areas are notorious for their calm winds, so sailors avoid them. The tiny plastic pellets that make up the bulk of the debris are practically invisible to crews of freighters that pass through. Airplanes and satellites can’t detect them at all.
Curtis Ebbesmeyer and groups such as the Algalita Marine Research Foundation in Long Beach, Calif., are now spreading the word about garbage patches and their potential environmental impact. Algalita funds expeditions into the South Atlantic and the Sargasso Sea, a region of the North Atlantic famous for its dense mats of seaweed.
LINKS & REFERENCE
Computer modeling ocean currents Albert Semtner http://oceanmotion.org/html/impact/garbagepatch.htm http://oceanmotion.org/ http://www.mbari.org/staff/braccio/Science/semtner.html http://www.education.noaa.gov/Ocean_and_Coasts/Ocean_Currents.html http://www.worldwildlife.org/threats/pollution http://en.wikipedia.org/wiki/Marine_debris http://www.plasticoceans.net/the-foundation/
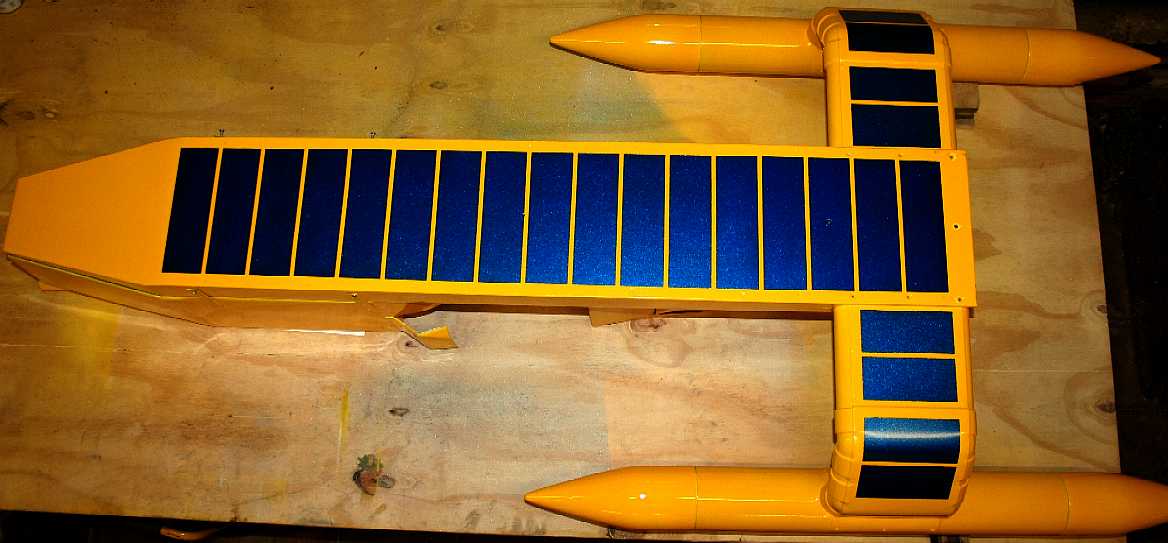
PROOF OF CONCEPT - The above vessel is a significantly modified version of the Bluefish ZCC concept, adapted to clean garbage from the world's ocean gyres. The SeaVax is a robotic ocean workhorse that is based on a stable trimaran configuration. This design uses no diesel fuel to cruise the oceans autonomously (COLREGS compliant) 24/7 and 365 days a year as required. With such awesome power generating capability, a SeaVax ZCC can extract plastic waste from deep sea ocean garbage patches. Several of these cleaners operating as Atlantic, Indian and Pacific ocean fleets could make such conservation measures cost effective, and even potentially attractive to governments around the world - for the health of the world. Recovered plastic could be processed to produce oil, energy or recycled products. Better than letting fish and seabirds eat the waste and kill themselves, and who knows how that may affect us, where seafood is an essential resource for mankind. You can help Bluebird Marine Systems take this design to a full size pre-production prototype by donating whatever you can afford when we are ready to accept crowd funding contributions. Thanks for reading this and please spread the news.
ACID OCEANS - ADRIATIC - ARCTIC - ATLANTIC - BALTIC - BERING - CARIBBEAN - CORAL - EAST CHINA ENGLISH CH - GULF MEXICO - GOC - INDIAN - MEDITERRANEAN - NORTH SEA - PACIFIC - PERSIAN GULF SEA JAPAN - STH CHINA - PLASTIC - PLANKTON - SEA LEVEL RISE - UNEP
|
||
|
This
website is Copyright © 2015 Bluebird Marine Systems Limited.
The names Bluebird™, Bluefish™,
SeaNet™,
SeaVax™
and the blue bird in flight
|